|
|
|
|
|
|
|
|
|
|
|
|
|
|
Experimental Basis for some Opioid Actions
4As noted before, morphine is an effective agonist at  -type
opioid receptors.
-type
opioid receptors.
Opioid receptors are concentrated in the spinal cord in the vicinity of the C-fiber terminals zones in lamina 1 in the substantia gelatinosa; reduced concentrations are noted in deeper layers.
The
distribution of receptor type appears as follows:
receptor -- 70%;  -receptor --24%;
 -receptor
-- 6%; this data was obtained from the rat model.
-receptor
-- 6%; this data was obtained from the rat model.
The method of determining percentages of the different receptor types involves the use of radioactive ligands (tritiated e.g.3H) which exhibit high affinity for the different receptor types.
Once bound to their respective receptor types, excess, unbound ligand is washed off the tissue, leaving only receptor binding sites identified by having a radioactive ligand attached.
The problem of localization of the ligand with respect to tissue is resolved using a technique called autoradiography.
In this method, photographic emulsion (film) is placed over the tissue slice sample.
The radioactivity from the highly localized receptors exposes the film and such exposure occurs only at the site directly above the receptor-tritiated ligand complex.
By counting the number of exposed photographic "grains" one can quantify the number as well as defined the localization of each of the opioid receptor types.4j
An additional consideration has to do with the percentage of receptor sites which can be specified as "presynaptic" or "postsynaptic".
This estimate was derived by first determining the total radioactivity, presumably the sum of pre-and post-receptor sites and then secondly redetermining radioactivity eight days after unilateral dorsal nerve sectioning.
Sectioning affected segments C4 - T2, with C7 used as a reference section.
After eight days, the C7 segment was considered completely deafferented due to previous sectioning and therefore the remaining autoradiographic sites were assigned at postsynaptic localization (all presynaptic sites having been lost due to sectioning and neuronal degeneration)
As an example of what an autoradiogram looks like, the picture below shows both the tissue outline of a section of hippocampus and the localization in green of specific, in this case, RNA.
|
|
|
"Presynaptic" or "postsynaptic" opioid receptor sites:
The results of C7 transaction as described
above with autoradiographic analysis indicate that most (70%) of the
-type
opioid receptors are localized at presynaptic sites on the peripheral
nociceptive fibers.
As discussed elsewhere, at these presynaptic
sites, -type and
-type
opioid agonists upon binding increase potassium channel conductance
which in turn causes membrane potential hyperpolarization.
Primary afferent hyperpolarization decreases the likelihood of transmitter release.
This presynaptic effect is supported by measurement of C-fiber mediated transmitter release and assessment of the effect of opioids on this process.
One type of experimental preparation involves placing thin spinal cord slices in an appropriate biological medium from which samples may be withdrawn.
The samples are assayed to determine glutamate and aspartate levels.
The measurement technology involves high-performance liquid chromatography and fluorimetric detection.
Electrical stimulation of the slices result in activation of both low and high-threshold primary afferent fibers; such activation induces significant increases in aspartate and glutamate outflow relative to the non--stimulated control.
The
use of a -receptor agonist
reduced the high-intensity stimulation-evoked aspartate and
glutamate release.
This opioid effect was sensitive to naloxone; in the presence of naloxone, such opioid-mediated reduction in aspartate & glutamate release was blocked.
These results suggest that glutamate and aspartate are likely excitatory synaptic transmitters in the spinal dorsal horn and furthermore that of their activity may be attenuated by opioid agonist presynaptic effects.4k
4Concerning plasticity and opioid activity
4Concerning plasticity, an opioid activity:
The likelihood that a particular dose of an opioid will inhibit pain is dependent on not only on the stimulus intensity but also on the level of neuronal activity within the excitatory systems.
The level of excitatory system activity involves the extent of NMDA receptor activation.
Wind up appears less opioid sensitive than steady responses of cells that do not show wind up.
Furthermore, there is a significant difference between the effect of opioids and NMDA antagonists on windup.
NMDA receptor activation results in spinal neurons involved in pain transmission to be stimulated with reduced peripheral input.
This phenomenon is called "windup"
As suggested earlier, morphine will diminish/block C-fiber input to the dorsal horn nociceptive neurons secondary to opioid mediated reduction of primary afferent neurotransmitter release.
This latter affect occurring at presynaptic sites. In the absence those sufficient opioid dosage to block all neurotransmitter release, wind-up will eventually "break through", although the opioids will delay wind-up onset
On the other hand, NDMA blockers have no effect on input to the cells but prevent wind-up, the consequence of which is to eliminate a potentiated response resulting in a steady response.
Spinal cord anesthetics appear to act synergistically with morphine probably because the local agent reduces excitability which indirectly decreases NMDA-mediated activity.
4Cholecystokinin (CCK) is an important modulator of opioid efficacy at spinal and supraspinal sites.
CCK is a peptide expressed constitutively ( i.e. normally present) but can be upregulated in afferent fibers following nerve damage.
The effect of cholecystokinin is to reduce the analgesic effect of morphine; moreover, antagonists of CCK binding and its receptor increases the efficacy of morphine.
Accordingly, CCK-B receptor activation would be in opposition to the analgesic action of morphine and such upregulation appears important in the reduced level of opioid effectiveness in neuropathy.
By contrast, reduced cholecystokinin levels appear associated with increased spinal level analgesic activity of opioids.
 |
4Alterations in opioid activity may also follow from changes in activity of descending noradrenergic fibers.
These fibers release norepinephrine and can interact with
![]() 2
presynaptic receptors.
2
presynaptic receptors.
Activation of these presynaptic receptors tend to inhibit transmitter release.
Clonidine would be an example of a
presynaptic ![]() 2
receptor agonist which has the effect of both potentiating morphine activity
as well as producing an antinociceptive effect on its own.
2
receptor agonist which has the effect of both potentiating morphine activity
as well as producing an antinociceptive effect on its own.
Dexmedetomidine is a related agent which exhibits increased potency and selectivity and is presently used "off label" in the anesthetic setting in addition to its FDA-approved application for ICU sedation.
In inflammation an increase in descending noradrenergic pathway activity suppresses spinal nociception; however, the reduction in cholecystokinin concentration is probably more important in terms of enhancement of morphine analgesia.
4Modulation of opioid analgesic efficacyis represented in the figure below:
 |
![]()
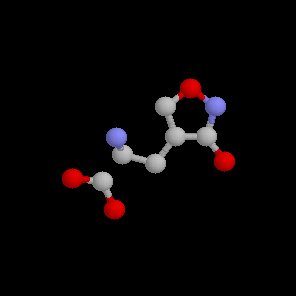
10Nociceptors which synapse with the spinal cord dorsal horn utilize glutamate as the principal neurotransmitter.
Glutamate interacts with several receptor systems; however, the AMPA receptor system is mostly involved with acute pain sensation [AMPA ( alpha-amino-3-hydroxy-5-methyl-isoazole-4-propionic acid)].
By contrast, glutamate interacts with the NMDA receptor in support of chronic pain sensation.
These receptors appear not to be functional unless a persistent, large-scale glutamate release has occurred. Molecular characteristics of the NMDA receptor will be discussed below.
12L-glutamate is the principal excitatory neurotransmitter in mammalian central nervous system operating by means of ligand-gated channels and by way of coupling through G-protein second messenger systems.
The focus in this presentation is on the ionotropic (ion channel-type) glutamate system which is composed of multiple subunits (4-5) and is divided into three groups: AMPA, NMDA, and Kainate receptors.
The basic structure, as noted with other ligand-gated channels (e.g. GABAA receptor), involves subunits with four hydrophobic domains (thermodynamically unfavoring the aqueous environment) occupying a central portion of the sequence.
Ionotropic glutamate receptors are classified in accord with the figure below:
 |
12Structural details of the inotropic glutamate receptors are highlighted in the figure below:
The hydrophobic component resides in the bilayer constituting the central part of the sequence (TMI-TMIV).
An unusual characteristic of the subunit is that the TMII element forms a re-entrant loop causing these receptors subunits to exhibit an extracellular N-terminus and a intracellular C-terminus.
Then there is a long loop between TMIII and TMIV which tends to be intracellular; other ligand-gated ion channel subunits that in this case is exposed to the cell surface form a part of the ligand-binding domain.
The ionotropic glutamate receptor systems appear quite diverse as a result of influences preceding and following gene transcription.
The subunits which constitute the receptor are each separate gene products.
Gene expression results in pre-mRNA which can be modified such that different regions of a mRNA molecule can be spliced together resulting in multiple mRNAs which are then translated at the ribosomal level to separate, different proteins.
This phenomenon is called "splice variation" and is a feature of several neuroreceptors.
There may be subsequent RNA editing which involves specific nucleotides in the mRNA sequence to be enzymatically altered which will then change their amino acid code.
This type of editing influences subunit calcium permeability exhibited by the AMPA-type subunit GluR2 (above figure) and the kainate receptor subunit GluR5.
 |
|
|
 |
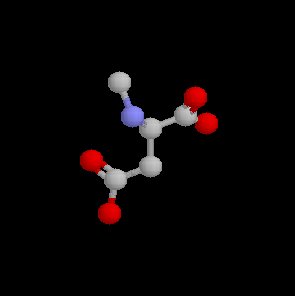
10NMDA receptors (N-methyl-D-aspartate receptors) appear to be more involved in chronic pain sensation.
NMDA receptor activation results in spinal neurons involved in pain transmission to be stimulated with reduced peripheral input.
This phenomenon is called "windup" and is associated with a reduction in glutamate required to cause pain transmission on one hand and an increased requirement for antinociceptive input on the other to retard the effect.
|
|
|
Under these circumstances, endorphins and other endogenous substances ultimately become ineffective in pain management and furthermore synthetic agents often must be administered at elevated dosages to treat pain effectively under the circumstances. An important consequence of this analysis is that a major cause of opioid tolerance is insufficiently treated pain as opposed to the administration of the opioid itself.
|
|
NMDA ((N-methyl-D-aspartate ) |
|
|
|
|
|
|
|
NMDA receptors consist of assemblies of NR1 and NR2 subunits. NR2 subunits may be one of four separate gene products (NR2A-D). The formation of functional channels requires the expression of both subunits.
|
|
|
|
Variation in the receptor can be produced by through the use of different NR2 subunits in the complex.
Furthermore, the NR1 subunits can present with multiple splice variance secondary to differential mRNA splicing (mRNA derived from a single gene).
Two loci for spliced variation have been identified -- one in the N-terminus and a second in the C-terminus regions. Such splice variations may be important in receptor regulation.
4The NMDA receptor is probably involved in long-term CNS activity is including long-term potentiation in hippocampus, in visual cortex synaptic plasticity, in epileptic activity, and insisting motor activity.
The first "direct" evidence for NMDA receptor involvement and "wind up" in cellular responses to prolonged stimuli was based on dorsal horn cellular responses to peripheral injection of formalin [formalin is a chemical which will cause lung-term, persistent inflammation].
Following such persistent inflammation, dorsal horn cellular responses were reduced, but not eliminated by NMDA-receptor antagonists, glycine-site antagonists and calcium channel blockers.4b
4Dorsal horn responses and behavioral responses to formalin or characterized by an early acute response interpreted to be a consequence of direct formalin action on peripheral nociceptive nerve endings, followed by a quiescent period and then a subsequent phase occurring about 15 minutes later.
The secondary long-term phase is likely the consequence of peripheral inflammatory mediator action -- e.g. prostaglandins and bradykinin activating C-fibers and then dorsal horn nociceptive neurons.
The secondary phase is sensitive to the NMDA receptor blockade suggesting that long-term inflammatory pain can be discriminated from acute pain as a result of this NMDA blockade difference. 4b
Comparable phases have been identified in other inflammatory models.4c
The original demonstration of central hypersensitivity was based on a hypersensitive withdrawal reflex induced by C-fiber stimulation and this hypersensitivity appears NMDA dependent.4d
Neuronal responses (both their induction & maintenance) depend on the NMDA activity since NMDA antagonists are effective in influencing the enhanced responses whether these agents are given either in pretreatment or during the enhanced response.
Several studies indicate that is the enhanced-hypersensitive response not the baseline response to pain that would be NMDA-receptor dependent.
4Experiments that illustrates this type of hypersensitization were performed in impact animals while under full general anesthesia -- suggesting that the events which promote enhanced nociception can occur in the setting.
One conclusion is that postoperative pain may in part be due to NMDA system effects that occur during the operation.
Concerning neuropathic pain: animal models have been used to assess the involvement of the NMDA receptor system.
NMDA antagonist use suggests that certain hyperalgesia, spontaneous pain and some forms of allodynia [allodynia is a condition which ordinarily nonpainful stimuli evoke pain.] are effects which depend on the NMDA receptors.
In this setting, the NMDA receptor system is involved in the induction phase, setting up the enhanced response, and prolonged maintenance of this enhanced hypersensitive state.4e,4f
Spinal NMDA-mediated neuronal inflammatory responses can be blocked by spinal NMDA-receptor antagonism as well as by peripheral local anesthetic blockade. In the clinical syndrome, sympathetic dystrophy, symptoms may be disrupted by local anesthetic blockade of peripheral drive. This situation describes the system which needs a level of peripheral afferent input arriving in the spinal cord only then to be amplified and prolonged by more centrally located systems -- and the NMDA receptor plays a central role.
Clinical implications of NMDA in pathological as opposed to acute pain: Ketamine and dextromethorphan are agents which are not only used clinically (anesthetic/analgesic & antitussives) but also are effective NMDA receptor blockers.4g Subanesthetic doses of ketamine block NMDA sites and both ketamine and dextromethorphan have been employed to manage opioid-insensitive neuropathic and cancer pain -- an observation which might be expected from findings in animal models.
Wind up has been noted in human psychophysical studies, post-herpetic neuralgia pain and intractable cancer pain may be reduced or abolished by these agents as well.4h,4i
 |
12The AMPA receptors (above) support fast CNS synaptic transmission.
These receptors consists of GluR1-4 subunits, each of which represents a separate gene product.
In a manner consistent with ionotropic glutamate receptors subunits, the subunits exhibits an extracellular N-terminus with an intracellular C-terminus.
The ligand-binding region is shown in the box above consists of S1 & S2 N-terminal regions.
The C-terminus contains binding sites for other modulating agents that may be important in receptor transport.
AMPA receptor subunits present as two splice variants, flip and flop.
Small changes in receptor subunit composition can translate into significant changes in desensitization properties.
AMPA receptor channels are usually impermeable to calcium, a property controlled by the GluR2 subunit.
Calcium permeability of the subunit is specified by post-transcriptional modification of the GluR2 mRNA.
Molecular biological analysis is specified that this change is located in the TMII region and is manifest as a single amino acid change from glutamine (Q) to arginine (R).
The site is therefore called the Q/R editing site and GluR2 (Q) is calcium permeable and the GluR2 (R) form is calcium impermeable.
This characteristic along with interactions with some additional intracellular proteins suggest that GluR2 may be the most important AMPA receptor subunit.

10The model below illustrates neurochemical elements associated with acute and chronic pain.
Initial pain transmissions cause glutamate release into the synaptic cleft between nociceptors and dorsal horn cells.
For acute pain, glutamate activates AMPA-type receptors located on Na+,K+ channels.
Prolonged activation induces changes in membrane polarization probably associated with removal of the Mg2+ "plug" in the Ca2+ channel.
Furthermore, NMDA receptors in the complex are primed for glutamate activation (supporting chronic pain).
Increases in intracellular Ca2+ , acting as a second messenger, stimulates protein kinase C which in turn results in increased nitric oxide (NO) formation by activation of NO synthase.
According to this model, the dissolved gas and second messenger NO diffusesthrough the dorsal cell membrane and synaptic cleft into the nociceptor thus activating a guanyl synthase-mediated K+ channel closure.
Endorphins and enkephalins are thought to inhibit pain by activating K+ channels; therefore, because opening of these channels have been inhibited by other mechanisms, opioid resistance is exhibited.
NO additionally causes release of substance P which binds to a receptor called NK-1 located in the dorsal horn membrane.
Such binding induces increased c-fos gene expression which itself promotes hypersensitization.
 |

With the discovery of receptors for opioids,the question was immediately raised with respect to the possibility of endogenous substances that would physiologically interact with these receptors.
Brain pentapeptides were discovered and exhibited significant affinities for opiate binding sites.
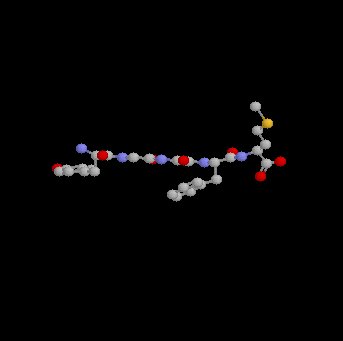
These agents were methionine-enkephalin (Tyr-Gly-Gly-Phe-Met) and leucine-enkephalin.
Opiate effects induced by these pentapeptides were blocked by naloxone.
Endogenous opioid peptides,![]() -endorphin
and dynorphin have also been described.
-endorphin
and dynorphin have also been described.
 |
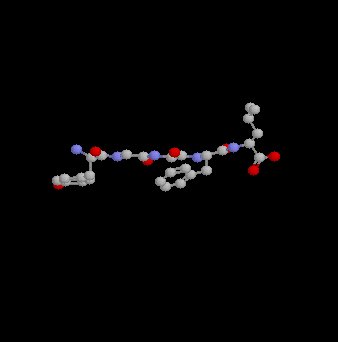 |
Methionine Enkephalin |
Leucine Enkephalin |
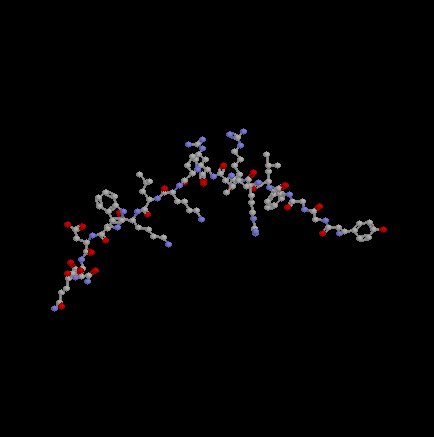 |
Dynorphin |
1Neurophysiological effects of opioid administration:
In pain free volunteers: IV opioid administration typically produces drowsiness, lethargy, apathy, dizziness and sleep.
An example, using fentanyl doses that results in "analgesic plasma concentration" [1-2 ng/mL (nanograms/milliliter)].
In this case, sedation would be observed comparable to that obtained with propofol or midazolam, although the amnestic effect would be attenuated.
Following IV administration,opioids initially induce cough (briefly), followed by cough suppression.
Furthermore, opioids relieve anxiety as well as "air hunger".
The beneficial effect on dyspnea is do not only to an anxiolytic action but also due to preload reduction.
Well-known respiratory effects of course include respiratory suppression.
Opioid administration often induces pruritus.
15Pruritus associated with opioids is more typically observed following epidural and subarachnoid administration compared to systemic administration.
Pruitus, furthermore, is more commonly noted in pregnancy compared to non-pregnant patients.
Management of narcotic-induced pruritus is included chlorpheniramine (antihistamine) administration, although chlorpheniramine would be associated with sedation.
There appears to be little evidence to support that opioid-induced pruritus is due to histamine release although the mechanism for such pruritus remains to be determined.
Fentanyl is an example of an opioid which does not cause histamine release.
Since agents such as chlorpheniramine are associated with prominent sedation and the patients may go to sleep, the issue of itching is in that sense laid to rest.
15What follows is an example of potential interactions between antihistamine and opioid-induced sedation and respiratory depression.
In this clinical senario, a young female patient received fentanyl and bupivacaine lumbar epidural analgesia in anesthesia for labor pain, cesarean section and for management of postoperative pain.
A bolus administration of 10ml of
0.25% bupivacaine for labor pain was followed by infusion (fentanyl
2
![]() g/ml
with bupivacaine 0.125% at 10ml/h.
g/ml
with bupivacaine 0.125% at 10ml/h.
After three hours, delivery occurred via cesarean section.
For the cesarean section,
the individual was managed using 14ml bupivacaine 0.5% and
fentanyl 100
![]() g
which caused a blockade from T4-S5.
g
which caused a blockade from T4-S5.
Postoperative pain management involved epidural infusion (fentanyl
4
![]() g
with bupivacaine 0.02%) delivered at a rate of 7/hr.
g
with bupivacaine 0.02%) delivered at a rate of 7/hr.
The patient remained pain-free exhibiting normal vital signs but was slightly drowsy for 4 h following the procedureand at that time complained of itching which is managed by IM injection of chlorpheniramine (10mg).
Approximately 35 minutes following the chlorpheniramine injection, the patient was found to be somnolent with a depress respiratory rate of 4/min.the patient was revived by naloxone administration (0.4 mg) with assisted ventilation.
Opioid side effects include respiratory depression; furthermore, the highest risk of respiratory depression is noted 4-8 h following epidural or intrathecal opioid administration.
There is an increased likelihood of delayed respiratory depression associated with those opioids which are relatively less lipid soluble (morphine) compared to more lipid soluble agents (e.g. fentanyl).
Early respiratory depression can be observed with continuous epidural infusion of very lipophilic opioids since systemic uptake results in significant plasma drug levels.
In one survey (Sweden), following epidural opioids respiratory depression was observed in about 0.2%-0.4% of non-obstetric patients.
Respiratory depression in this analysis was noted most commonly in elderly patients receiving parenteral narcotics, hypnotics, and neuroleptic agents perioperatively.15a
Although elderly patients may exhibit increased sensitivity to opioids, younger patients also present with somnolence and respiratory depression at higher opioid dosages.
Significant
respiratory depression may be noted with a relatively low dose
of epidural fentanyl (100
![]() g
).15b
g
).15b
Higher than expected CNS opioid concentrations can occur if the epidural catheter moves into the subarachnoid space.15c
In this clinical senario, the patient had
received fentanyl (300![]() g)
over a period of 9h.
g)
over a period of 9h.
The significant respiratory depression and somnolence could be attributed to the patient's idiosyncratic sensitivity to opioids or epidural catheter migration into the subarachnoid space resulting in excessive CNS fentanyl concentrations.
The rapid increase in the patient's level sedation following chlorpheniramine administration suggests that the antihistamine potentiated a well known fentanyl side effect.
At least for the authors of this case analysis, the above experience resulted in a reevaluation of chlorpheniramine use in the management of opioid-induced pruritus.
They recommend that opioid antagonists (e.g. naloxone) or partial agonists (e.g. nalbuphine) or 5-HT3 antagonists (e.g. ondansetron) but NOT antihistamines to be used in management of narcotic-induced itching.
Opioids are a common cause those nausea and vomiting in a relatively less frequent cause of euphoria or dysphoria.
Transient flushing with an associated hot sensation is due to histamine release following morphine or meperidine administration.
1Opioids as anesthetics?
The question of whether or opioids are anesthetics in part has to do with whether these agents adequately (completely) suppressed awareness.
High-dose fentanyl administration has been associated with patient awareness.
One method to assess opioid anesthetic potential has been to observe changes in a volatile anesthetic's MAC value when given in combination with opioids.
Analgesic opioid doses have been reported to reduce MAC values for potent inhaled anesthetics by about 50%; even large additional opioid administration does not result in a significantly greater MAC reduction.
Judgments about the "completeness" of opioid anesthesia is complicated by differing effects depending on the particular animal model.
The rat appears particularly susceptible to opioid effects in this regard allowing the view that an opioid could provide complete anesthesia. (see graph below).
This conclusion is probably not supported in the dog model.
From several points of view the dog model appears similar to a human model. At all events, interspecies differences make a firm conclusion problematic.
 |
1Not all opioids are equally potent in terms of reducing the MAC value for another agent.
One example of this phenomenon is the observation that sufentanil administration more substantially reduces thiopental doses needed to produce loss of consciousness, as compared to fentanyl.
Opioids are able to produce unconsciousness which would be defined as a lack does response to verbal commands; however, overall opioid anesthesia is regarded as inconsistent.
 |
| Fentanyl Concentration (ng/mL) | Isoflurane MAC (95% CI,%) | Isoflurane MAC % reduction is a function of fentanyl concentration |
| 0 | 1.2 (0.99, 1.62) | -- |
| 1 | 0.73 (0.63, 0.88) | 39% |
| 2 | 0.55 (0.45-0.65) | 54% |
| 3 | 0.45 (0.35, 0.54 | 63% |
| 6 | 0.30 (0.21, 0.38) | 75% |
| 10 | 0.22 (0.13, 0.30) | 82% |
1Age dependency:
Using unconsciousness as the end point, fentanyl administration can produce, in the context of anesthesia induction, unconsciousness in a variable percentage of patients, depending on age:
Using the fentanyl administered at the following dosage, 30
g/kg, produces unconsciousness in 57% of patients in the 18-19 age
group.
This percentage rises to 77% in the 31-45 age group; it decreases to 53% in the 46-60 year age group and is at 100% in the > 60 age group1n.
|
|
|
|
|
|
|
1Patient Awareness under General Anesthesia
1A concern with the opioids as well as other agents of course is the possibility of patient awareness during anesthesia/surgery.
By definition, awareness would be defined as "the spontaneous recall of events occurring during general anesthesia and surgery."
This phenomenon would be is referred to as "explosive memory".
Sometimes information or awareness of mental images are information under general anesthesia can occur without specific conscious recollection -- a phenomenon referred to as implicit memory.
Under inhalational anesthesia, auditory function remains intact.
Therefore, it probably is not a reasonable objectives two attempt to block retention of all information the patient might obtain well under general anesthesia.
What is a concern, however, would be the "consolidation" of this material and attendant conscious remembering of interoperative activities.
Awareness is a concern and has been associated with a variety of anesthetic methodologies.
The basic significance of the concern was emphasized mainly in the context of high-dose fentanyl anesthesia.
1Factors have been identified as contributing to awareness and these factors include:
inadequate anesthetic technique
absence of premedication
use of ultrashort-acting IV induction agents
excessive or unnecessary neuromuscular-blockade
difficult or prolonged intubation
equipment failure
ASA physical classification of IV or V, obstetrical procedures
the presence of morbid obesity
cardiac surgery
anesthetist inexperience
bronchoscopy
pharmacological autonomic blockade
high-altitude anesthesia and increased anesthetic requirement.
Some surgical procedures are more likely associated with patient awareness than others.
For example, a high incidence of awareness (7%-43%) has been suggested for patients undergoing anesthesia for obstetrical, as well as cardiac surgery.
![]() Awareness in general anesthesia may occur at a rate of up to 1%.
Awareness in general anesthesia may occur at a rate of up to 1%.
1Detecting awareness:
Increases in motor and autonomic signs are clinical indicators of awareness.
Specifically, these changes include eyelid motion, swallowing, coughing, increased spontaneous respiratory activity, facial grimacing, with head/extremity motion.
These occurrences are thought to suggest inadequate amnesia.
An anesthesia level which is considered "too light" would be indicated by salivation, sweating, mydriasis, tearing, tachycardia, or hypertension.
Assessment (monitoring) of muscle activity may be a reasonable approach since these movements are likely to occur in advance of awareness, i.e. motor signs may occur before hemodynamic or other autonomic presentations indicative of potential patient awareness.
Measurement of facial muscle activity, isolated forearm techniques, an indication of esophageal motility have also been identified as techniques useful for detecting awareness1o.
1,1pAnalysis of CNS electrical activity has been a basis for awareness assessment as well.
These approaches have included audio evoked potential measurements as well as EEG analysis-- the latter requiring mathematical transformations before useful information is available for this application.
Bispectral analysis (BIS) is a signal processing technique which has been applied to EEG analysis.
The EEG signal is described not only in terms of variable frequencies and signal amplitudes but also in terms of the degree of signal synchronization.
BIS monitoring does not appear to reveal significant opioid effect, except at high doses; however, interactions between opioids and sedative hypnotic drugs are described by BIS monitoring.
Minimizing awareness during general anesthesia:
Preoperative patient evaluation would include the determination of the ability of the patient to tolerate anesthesia as well as the extent to which opioids might be part of the anesthesia protocol.
A discussion of the possibility of patient awareness would be particularly relevant if the anesthesia plan involve significant use of opioids come e.g. certain cardiac cases.
In a British study, about 41% of patients later described that they felt pain during their awareness episodes1q.
Muscle relaxant use (and misuse) may be a factor that limits the anesthetists' ability to detect patient awareness.
This conclusion follows from muscle relaxant suppression of motor signs that indicate patient awareness.
Therefore reducing the use of relaxants i.e. limiting use to appropriate indications while not utilizing them as substitutes for anesthesia or to routinely prevent movement may decrease the likelihood of patient awareness going undetected.
Another approach which may reduce the likelihood of interoperative patient awareness is administration of sedative-hypnotic agents preoperatively.
These agents could include nitrous oxide, droperidol, diazepam. 0.3-0.6 MAC, corresponding to "MAC awake" concentrations of potent inhalational drugs appears to prevent recall and volunteers and may prevent awareness in patients.
![]() Given the possibility that patient awareness may not be suppressed
even using standard anesthesia drug protocols, there is a rational basis
to limited interoperative conversation that would contain information
that the patient would find personally relevant -- including unnecessary
discussion of the patient's case such as discussion of prognosis.
Given the possibility that patient awareness may not be suppressed
even using standard anesthesia drug protocols, there is a rational basis
to limited interoperative conversation that would contain information
that the patient would find personally relevant -- including unnecessary
discussion of the patient's case such as discussion of prognosis.
The likelihood of specific interoperative events associated with increased awareness appears proportional to the potency of surgical stimulation. For example, events most likely associated with increased awareness would include sternotomy, aortic root dissection, laryngoscopy, skin incision, and intubation.
The patient may not report awareness and such lack of reporting should not be considered evidence that awareness infected not occur. Awareness during surgery may be manifest later in terms of the traumatic neurosis which could include preoccupation with death, anxiety,and nightmares.
1EEG
EEG changes associated with increasing concentrations of inhaled anesthetic are clearly progressive ultimately leading to burst suppression and then a flat EEG.
By contrast, increasing opioid dosages produces an effect that plateaus.
That is, increasing the
dosage further, with an opioid, does not produce additional EEG
suppression.-receptor agonists,
such as fentanyl, alfentanil, sufentanil, or remifentanil produce
similar EEG effects assuming that differences in potency and
pharmacokinetic characteristics have been taken into account.
Relatively small fentanyl doses (200 g) do not produce significant EEG alteration; however, higher doses
(30-70 g/kg) produce high-voltage
slow waves (delta waves) which is suggestive of an anesthetic
state.
Within this background of high-voltage slow waves, non-generalized sharper wave activity may exist in the presence of fentanyl and other opioids.
Sufentanil produces changes similar to those observed with fentanyl although some studies have indicated a lower plasma concentration can induce these changes in elderly subjects.
EEG states thought consistent with anesthesia have been
defined in association with sufentanil doses as low as 2.5
g/kg.
The higher doses of fentanyl and sufentanil tend to produce more profound EEG changes compared to morphine.
EEG utility: e.g. monitoring can be used to provide endpoints assessing drug action onset times as well as potency ratios.
One example of this EEG application was the determination that alfentanil is more rapidly acting compared to fentanyl.
Specifically, the lag time between plasma drug concentration in a change in the "spectral edge" was found to be only 1 minute for alfentanil compared to 6 minutes for fentanyl with appropriate adjustments for potency differences. [EEG spectral edge frequency changes also correlate with the hemodynamic response to laryngoscopy and intubation Rampil IJ, Matteo RS Anesthesiology. 1987 Jul;67(1):139-42] [The spectral edge frequency (SEF) is often calculated as the frequency below which 90% of the power in the EEG exists;
"Spectral edge frequency is a quantitative single-number variable of EEG.
It was developed in early 1980s by Ira Rampil, initially to be used in a multiple feedback-loop close-loop controller for halothane anaesthesia.
To calculate the SEF, EEG samples are repeatedly examined in the frequency domain.
The frequency/amplitude contents of the signal are presented as the EEG spectra, where slow activity is displayed at the left end and fast activity at the right end of the frequency axis."A. Yli-Hankala (Yli-Hankala,A Will enough isoflurane during surgery replace morphine after surgery? Acta Anaesthesiologica Scandinavica Volume 47 Issue 7 Page 785 - August 2003)
The above definition by Yli-Hankala16 was developed in reference to another work17 suggesting that the most appropriate interoperative isoflurane concentration might be associated with a reduced postoperative morphine requirement in obese patients.
As part of that study the anesthetic "depth" of the patient was assessed using this spectral edge frequency technique.
The EEG consists of a number of different frequencies with differing amplitudes.
The spectral edge frequency would reflect of the highest detectable EEG activity for a given spectrum.
The given spectrum might be a spectrum obtained at a particular time following anesthesia or the EEG spectrum obtained following some particular drug dosage.
For example if a volatile anesthetic concentration is increased along with cerebral ischemia the fast waves of the EEG (higher frequencies) are suppressed.
In this example then the loss of some of the fast waves will decrease the overall spectral edge frequency.
Spectral and frequency analysis then can be useful not only in monitoring anesthesia depth of possibly also in the interoperative setting signaling the development of cerebral ischemia.
Since the EEG consists of many different frequencies and the spectral edge technique only looks at the faster waves (higher frequencies), some change occurring in other parts of the frequency i.e. slower wave elements would not be included in the results.
Concerns have been raised in (16) about whether intergroup differences were analyzed in a proper manner.
Despite concerns, one important conclusion is that the obese patient might be "dangerously under anesthetized if no EEG measures of hypnotic state are used."
Consistent with contemporary pain theory would then be the conclusion that more serious postoperative pain might obtain if the anesthesia was too light.
The central question in reference 17 however which
would have to do with an increased postoperative morphine
requirement following somewhat inadequate isoflurane anesthetic
depth remains to be determined more conclusively by future work.16
 |
|
 |
|
1To attain a similar EEG pattern for alfentanil and fentanyl, the serum concentration ratio was 75:1. by contrast, IV dose ratios would suggest that fentanyl is only 3-5 times as potent as alfentanil.
1If an endpoint is defined as half-maximal EEG slowing as evidenced by spectral edge data, then the serum drug concentration ratio would be 12:1 (fentanyl/sufentanil).
Using this approach, based on EEG slowing, fentanyl and remifentanil are 75 times in 16 times as potent as alfentanil respectively1,1r.
Potency ratios that are based on EEG analysis are very comparable to those obtained from studies based on the drug plasma levels of each opioid when the endpoint is the amount of opioid required to reduce the isoflurane MAC by 50%. Potency ratios are approximately 1: 0.1: 0.1: 0.0125 in the following order sufentanil: fentanyl: remifentanil: alfentanil.
1Opioids and Sensory Evoked Potentials:
Opioids generally do not alter somatosensory evoked potentials elicited by stimulation at the posterior tibial or median nerve.
Some changes produced in somatosensory evoked potentials (SEP or SSEP) latency of the magnitude of <3 ms in amplitudes (amplitude reduction of about 35%) following opioid administration +/- nitrous oxide and appear not to affect successful clinical monitoring.
 |
Some studies indicate that adding propofol (6
mg/kg/hour) to alfentanil (100g/kg/10
min) instead of adding nitrous oxide may be better for retention of
early posterior tibial nerve SEP peaks.
Median nerve SEP monitoring can
also be performed reasonably following sufentanil (5g/kg)
given that this dosage of fentanyl produced a stable/acceptable SEP
changes that still allow SEP latency alterations associated with
neurological injury to be identified.
Some clinical research has indicated that signal-to-noise ratios which are central to be able to identify the physiologically significant signal against the background electrophysiological noise may be better preserved with opioid-based anesthetic approaches by contrast to approaches utilizing potent inhalational agents1s.
1The use of opioids with other IV anesthetics may present challenges for reliable SEP assessment.
Limited change in SEP has been reported for the following protocol: fentanyl (10g/kg)
administered as a bolus following midazolam (0.3 mg/kg) and then
followed by a fentanyl infusion. reduced SEP amplitude with little
alteration in latency is associated with the following protocol:
thiopental (5-mg/kg bolus + 2-mg/kg/hour infusion) followed by fentanyl
(10g/kg).1
Remifentanil effects on evoked potentials appear similar to that noted with other fentanyl-related structures.
17Sensory Evoked Potentials--Overview
Evoked potentials of those electrical signals produced by the nervous system in response to sensory stimulation.
Examples of such stimulation could be of auditory, visual, or somatosensory in origin.
The sources are used for clinical evoked-potential analysis.
Somatosensory evoked potentials (SSEPs) are made up of a series of waveforms reflecting sequential neural structural activation along a somatosensory pathway.
These forms are referred to as "evoked" because they may be initiated by an electrical stimulation of a peripheral nerve.
Frequently, SSEP responses are induced by median nerve stimulation of the wrist, the common peroneal nerve is in the, and/or the posterior tibial nerve at the ankle.
Recording of the response may occur through reporting elect roads placed over the scalp, spine, and peripheral nerves.
The major anatomical system within the CNS for SSEP analysis would be the dorsal column-lemniscal system. (see figures below)
 |
|
18When stimulation occurs, impulses are propagated in both directions.
The normal direction is referred to as the dromic direction which evokes the SSEP; additionally, propagating in the opposite to normal direction (antidromic) induces a muscle response.
Therefore neural transmission occurs in both sensory and motor pathways of the peripheral nerve.
Ascending neuronal activity from the upper extremity represents mainly the activity in the proprioception and vibration pathways.
Propagated neural activity then enters the cord, passing through the dorsal root ganglia and without synapsing ascends in the spinal cord by way of the ipsilateral dorsal column ((fasciculus cuneatus).
The first synapse occurs near the nucleus cuneatus in the brainstem.
Following the synaptic contact, fibers cross to the opposite side of the brainstem close to the cervicomedullary junction and proceed up by way of the contralateral medial lemniscus.
The next synapse in the sequence occurs in the ventroposterolateral thalamic nucleus followed then by projection to the parietal sensory cortex.
Lower extremity stimulation results in recordings that likely include contributions by spinocerebellar pathway systems.
This finding may be important because the spinocerebellar tracks would be supplied by the same blood supply as the motor tracks and therefore would be affected in the comparable way by surgical pathology.
Posterior columns (fasciculus cuneatus and fasciculus gracilis) are supplied by the posterior spinal artery.
By contrast the spinocerebellar tract is supplied by the same arterial supply as that supplying the motor tracks, i.e. the anterior spinal artery.
Neurological disease assessment is one primary use for SSEP analysis.
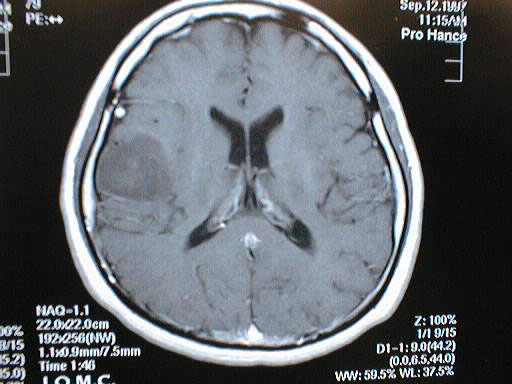
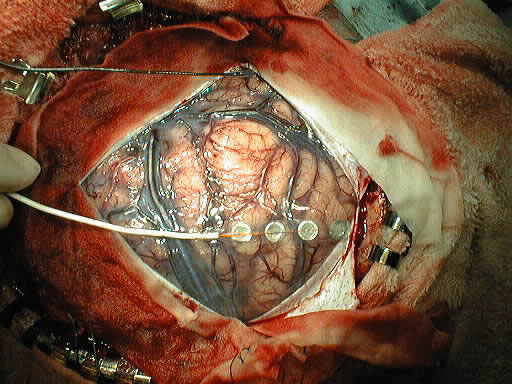
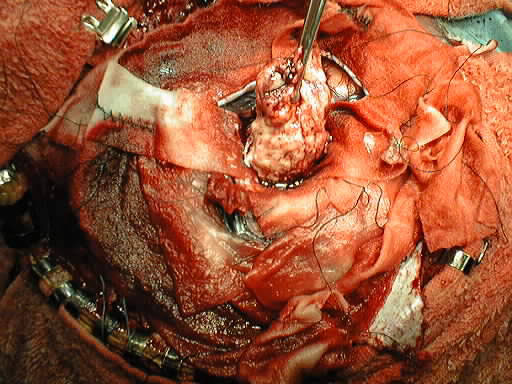
Another important use is in the interoperative monitoring particularly during those surgeries which may place elements of the somatosensory pathway in jeopardy. Note the tumor location below
Abnormal SSEP results can occur due to neural dysfunction at one or more of a number of sites, such as peripheral nerve, plexus, spinal roots, spinal cord, brain stem, thalamocortical projection, or primary somatosensory cortex.
Significant sensory deficit can be present even if recordings of SSEP signals are normal because of the presence of multiple parallel afferent somatosensory pathways, such as anterior spinothalamic tract & dorsal column tracks).
SSEP dependencies: for SSEP analysis to be possible one requirement is normal functioning of fast-conducting, large-diameter group IA muscle afferent fibers in group II cutaneous afferent fibers.
In those instances when a mixed peripheral nerve containing both motor and sensory elements, then the resulting SSEP contains contributions from both group IA muscle afferents in group II cutaneous afferents.
A particular dorsal spinal column ablation site would be expected to abolish SSEP responses generated rostral to the lesion site.
Abnormal SSEP results are expected for those diseases localized in the dorsal columns and manifested by abnormal joint position sense and proprioception.
18Intravenous anesthetics are typically much less depressant to cortical SSEPs as compared to inhalation agents. Etomidate, augments the size of the cortical evoked response when compared to the awake baseline.
The Table18 below provides general guidelines for anesthetic techniques favorable for monitoring.
Patients with abnormal responses will be much more sensitive to the effects of anesthetic agents than patients normal responses.
For the normal patient, about 25% of normal individuals will totally lose the cortical SSEP when the total concentration of nitrous oxide + potent inhaled agent exceeds 1.3 MAC. "A generally "safe" anesthetic technique for SSEP monitoring would be 0.7 MAC inhaled agent supplemented by an opiate infusion."
|
|
|
|
|
|
|
|
|
1Bailey, PL, Egan, TD, Stanley, TH, "Intravenous Opioid Anesthetics", in Anesthesia 5th edition, Miller, R.D., editor, Churchill Livingstone, Philadelphia, 2000, 273-377 (references secondarily sourced from this primary reference are noted below in the indented references)
1aLowenstein, E, Hallowell P, Levine FH et al.: Cardiovascular response to large doses of intravenous morphine in man.N. Engl J Med 281:13 89, 1969
1b Stanley, TH, Webster LR; Anesthetic requirements and cardiovascular effects of fentanyl-oxygen and fentanyl-diazepam-oxygen anesthesia in man. Anesth Analg 51:901, 1972.
1c Arens, JR, Benbow, BP, Ochsner JL et al: Morphine anesthesia for the aorto-coronary bypass procedures. Anesth Analg 57: 411, 1978
1d Stanley, TH, Gray NJ, Staford W. et al: The effects of high-dose morphine on fluid and blood requirements in open-heart operations. Anesthesiology 38:536, 1973.
1e Stoelting, RK, Gibbs PS, Creasser CW et al: Hemodynamic in ventilatory response to fentanyl, fentanyl-droperidol, and nitrous oxide in patients with acquired valvular heart disease. Anesthesiology 42:319, 1975.
1f Bowdle, TA, Ward, RJ: Induction of anesthesia with small doses of sufentanil or fentanyl: Dose versus EEG response, speed of onset and thiopental requirement. Anesthesiology 70:26, 1989
1gHecker BR, Lake CL, DiFazio CA et al: The decrease of the minimum alveolar anesthetic concentration produced by sufentanil in rats. Anesth Anal 62:987, 1983.
1hGoldstein,A: Opiate receptors. Life Sci. 14:615, 1974.
1iSnyder SH: Opiate receptors in the brain. N Engl. J Med to 96:266, 1977.
1jMayer, DJ, Wolfle, TL, Akil H et al: Analgesia from electrical stimulation in the brainstem of the rat. Science 174:13 51, 1971.
1kFields, HL: Brainstem mechanisms of pain modulation: Anatomy and physiology. In Herz, A (ed): Opioids II: Handbook of Experimental Pharmacology. Berlin, Springer-Verlag, 1993, p.3.
1lKissin I, Vinik HR, Castillo R et al:Alfentanil potentiates midazolam-induced unconsciousness in subanalgesic doses. Anesth Analg 71:65, 1990
1mMcEwan AI, Smith C, Dyar O et al: Isoflurane minimum alveolar concentration reduction by fentanyl. Anesthesiology 78:864, 1993.
1nBailey, PL, Wilbrink J, Zwanikken P et al: in Anesthetic induction with fentanyl. Anesth. Analg 64:45, 1985.
1oHeier, T, Steen, PA: Assessment of anesthesia depth.Acta Anaesthesiol Scand 40:10 87, 1996.
1pSebel PS Lang E Rampil IJ White PF Cork R Jopling M Smith NT Glass PSA Manberg A multicenter study of bispectral electroencephalogram analysis for monitoring anesthetic effect Anesth. Analg. 84(4) 1997 891-899.
1qJones, JG: Use of evoked responses in the EEG to measure depth of anesthesia. In Lunn J, Rosen M (eds): Consciousness, Awareness and Pain and General Anesthesia. Boston, Butterworth, 1987, p 99.
1rEgan TD, Minto CF, Hermann DJ et al: Remifentanil versus alfentanil: Comparative pharmacokinetics and pharmacodynamics. Anesthesiology 84: 821, 1996.
1sKalkman CJ, Rheineck AR, Bovill JG: of high-does opioid anesthesia on posterior tibial nerve somatosensory cortical evoked potentials: Effects of fentanyl, sufentanil, and alfentanil J Cardiothorrac Anesth 2:758, 1998.
2Coda, BA, "Opioids" in Clinical Anesthesia, 4th edition, Barash, PG, Cullen, BF, Stoelting, RK, editors, Lipincott Williams & Wilkins, Philadelphia, 2001, 345-375
2a Thorpe, DH: Opiate structures and activity: a guide to underlying opioid actions. Anesth Analg 63:143, 1984.
3Gottschalk, A and Smith DS, New Concepts in Acute Pain Therapy: Preemptive Analgesia, American Family Physician, May, 2001 http://www.aafp.org/afp/20010515/1979.html
First figure redrawn with permission by Gottschalk and Smith from: Kehlet H, Dahl JB. The value of "multimodal" or "balanced analgesia" in postoperative pain treatment. Anesth Analg 1993;77:1049.
Second figure redrawn with permission by Gottschalk and Smith from: Woolf CJ, Chong MS. Preemptive analgesia--treating postoperative pain by preventing the establishment of central sensitization. Anesth Analg 1993;77:368.
4Dickenson, AH Spinal cord pharmacology of pain. Br. J. Anaesth. 75: 193, 1995. (references secondarily sourced from this primary reference are noted below in the indented references)
4aBattaglia, G, Rustioni A. Coexistence of glutamate and substance P. and dorsal root ganglion cells of the rat and monkey. Journal of Comparative Neurology 1988; 277:302-312.
4bHaley, JE, Sullivan, AF, Dickenson, AH. Evidence for spinal N-methyl-D-aspartate receptor involvement in prolonged chemical nociception in the rent. Brain Research 1990; 518:218-222.
4cSchiable, HG, Grubb BD, Neugebauer, V, Oppmann M. The effects of NMDA antagonists on neuronal activity in cat spinal cord evoked by acute inflammation in the knee joint. European Journal of Neuroscience, 1991; 3:981-991.
4dWoolf CJ, Thompson, SWN. The induction and maintenance of central sensitization is dependent on N--methyl-D-aspartic acid receptor activation; implications for the treatment of post-injury hypersensitivity states. Pain 1991; 44:293-299.
4eMao, J, Price DD, Hayes, RL, Lu, J, Mayer DJ, Frank H. Intrathecal treatment with dextrophan or ketamine publicly reduces pain-related behaviors in a rat model of peripheral mononeuropathy. Brain Research 1993; 605:164-168.
4fPrice, DD, Mao, J, Mayer DJ. Central neural mechanisms of normal in abnormal pain states. In: Fields, HL, Lebeskind, JC, eds. Progress in Pain Research and Management. Seattle:IASP Press, 1994; 61-84.
4gRogawaki MA. Therapeutic potential of excitatory amino acid antagonists; channel blocks and 2,3 benzodiazepines. Trends in Pharmacological Sciences 1993; 14:325-331
4hEide PK, Jorum E, Stubhaug, A, Bremnes J, Breivik H. Relief of post-herpetic neuralgia with the N-methyl-D-aspartate receptor antagonist ketamine: a double-blind, cross-over comparison with morphine and placebo. Pain 1994; 58:347-354.
4iPrice DD, Mao J, Frenk H, Mayer, DF. Central neural mechanisms of normal in abnormal pain states. In:Fields HL, Lebeskind JC, eds. Progress in Pain Research and Management. Seattle:IASP Press, 1994; 61-84.
4jBesse, D, Lomabard, MC, Zajac, JM, Roques, BP, Besson, JM Pre- and and postsynaptic distribution of mu, delta, and kappa opioid receptors in the superficial layers of the cervical dorsal horn of the rat spinal cord, Brain Research 521 (1-2), June 1990 pp 15-22.
4kKangrga I and Randic M Outflow of endogenous aspartate in glutamate from the rat spinal dorsal horn in vitro by activation of low-and high-threshold primary afferent fibers. Modulation by mu-opioids Brain research 553, 2, July 1991,pp. 347-352.
5Substantia Gelatinosa Image: Courtesy of
The Digital Slice of Life, a cooperative project with the Slice
of Life office, KUED
Media Solutions, and the Knowledge
Weavers Project.
Ross, AF, Gomez, MK, Tinker, JH "Anesthesia for Adult
Cardiac Procedures in Principles and Practice of Anesthesiology, 2nd
edition, Longnecker, DE, Tinker, JH, Morgan, GE, eds, Mosby, St. Louis,
1998, pp. 1659-1698.
6Two-dimensional & Three Dimensional Images courtesy of CORD Center for Opioid Research and Design http://www.opioid.umn.edu/
7Jaffe, CC, Stewart, WB, Lynch, PJ, Hines, S., Cranial Nerves, Yale University School of Medicine, Center for Advanced Instructional media, (c) 1998 http://info.med.yale.edu/caim/cnerves/contents.html
8Kauffman, AM & Patel M, Center for Cranial Nerve Disorders http://www.umanitoba.ca/cranial_nerves/trigeminal_neuralgia/manuscript/index.html
9Chakrabarti, S, Oppermann, M Gintzler AR Chronic morphine induces the concomitant phosphorylation and altered Association of multiple signaling proteins: A novel mechanism for modulating cell signaling PNAS 98 (7) 4009, 2001
10Brookoff, D Chronic Pain: 1. A New Disease? Hospital Practice July, 2000 http://www.hosppract.com/issues/2000/07/brook.htm
11Protein Structure Study Guide http://www.princeton.edu/~actin/chm543_info.html#Study%20guide%201
12MRC Center for Synaptic Plasticity, University of Bristol, used with permission for non-commercial applications
13Breeze AL, Harvey, TS, Bazzo, R, Campbell ID Solution structure of Human Calcitonin Gene-Related Peptide by H NMR and Distance Geometry with Restrained Molecular Dynamics Biochemistry 30:575-582 (1991)
14Heish, JC, Carr, DB "Choosing a Therapeutic Approach: Opioids" in The Massachusetts General Hospital Handbook of Pain Management (Borsook D, LeBel, AA, McPeek, B, eds) Little, Brown and Company, Boston, 1996, pp 47-75.
15Anwari, J. S. & Iqbal, S. (2003)Antihistamines and potentiation of opioid induced sedation and respiratory depression. Anaesthesia 58 (5), 494-495
3aGustafsson LL, Schildt B, Jacobsen KJ. Adverse effects of extradural and intrathecal opiates: Reports of a nationwide survey in Sweden. British Journal of Anaesthesia 1982; 54:479-486.
3bBrockways MS, Nobel DW, Sharwood-smith GH, McClure JH. Are found respiratory depression after extradural fentanyl. British Journal of Anaesthesia 1990; 64:243-245.
3cHolmstrom, B, Rawal N, Axelsson K, Nydahl P. Risk of catheter migration during combined spinal epidural block. Percutaneous epiduroscopy study. Anesthesia and Analgesia 1995; 80:747-753.
16Yli-Hankala,A Will enough isoflurane during surgery replace morphine after surgery? Acta Anaesthesiologica Scandinavica Volume 47 Issue 7 Page 785 - August 2003)
17Gurman GM, Weksler N, Steiner O, Popescu M, Avinoah E, Porath A. The influence of cortical electrical activity level during general anaesthesia on the severity of immediate postoperative pain in the morbidly obese. Acta Anaesthesiol Scand 2003; 47:804-8
17Soliman E Legatt, AD Somatosensory Evoked Potentials: General Principles eMedicine, http://www.emedicine.com/neuro/topic640.htm, 8/2001.
18Black,
S, Sloan T., SOMATOSENSORY (SSEP) AND MOTOR EVOKED POTENTIALS (MEP) THE
SOCIETY FOR NEUROANESTHESIA AND CRITICAL CARE - 1998 ANNUAL MEETING http://analgesic.anest.ufl.edu/anest2/mahla/snacc/eps/