Introduction to Medical Pharmacology
Emax, potency, the therapeutic index, and the concept of receptor reserve
Chapter 3 · Module 2 of 4 · PDYN-02Section 1
The two parameters that define a drug’s efficacy and potency on a dose-response curve
Every drug that produces a graded, measurable pharmacological effect can be characterized by two fundamental parameters read directly off its dose-response curve: the maximum effect it can produce, and the concentration needed to produce half of that maximum effect. These two values, Emax and EC50, define a drug’s efficacy and potency respectively, and they are independent of each other.
When drug concentration is plotted against the magnitude of a pharmacological response for a single biological preparation, the result is a graded dose-response curve. On a linear concentration scale the curve is hyperbolic: response rises steeply at first and then levels off as the system approaches its maximum. On a logarithmic concentration scale — which is how these curves are almost always presented — the same relationship takes on a sigmoid (S-shaped) appearance. The logarithmic presentation is preferred because it compresses the wide concentration range into a usable graph and places the most informative region of the curve, where response changes most rapidly with dose, in the middle of the plot rather than at the extremes.
Two landmarks define the curve. The plateau at the top is Emax, the maximum effect the drug can produce in that system. The concentration at the midpoint of the rising portion — where the response is exactly 50 percent of Emax — is the EC50, the half-maximal effective concentration.
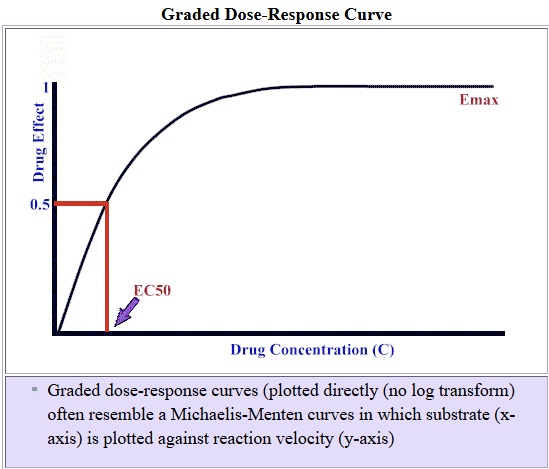
Emax is a property of both the drug and the receptor-effector system it engages. It reflects the drug’s intrinsic ability to activate the receptor and the maximum signaling capacity of the downstream pathway. A full agonist, by definition, produces the system Emax. A partial agonist produces a lower Emax, not because it fails to occupy receptors at high concentration, but because each partial agonist-receptor complex generates less downstream signal than a full agonist-receptor complex would.
The clinical implication is direct: when a patient needs the maximum pharmacological effect a receptor system can produce — for example, maximal pain relief in severe acute pain — a full agonist opioid like morphine can achieve what a partial agonist like buprenorphine cannot, because buprenorphine’s Emax for analgesia is lower than the system maximum. Efficacy, not potency, is the limiting factor in that situation.
The EC50 is the standard measure of drug potency. A lower EC50 means the drug produces half its maximum effect at a lower concentration — it is more potent. Potency matters clinically when the achievable drug concentration at the target site is limited: a more potent drug can produce its effect at a lower plasma concentration, which may reduce off-target effects or allow a smaller dose.
The slope of the dose-response curve between threshold and Emax also carries clinical information. A steep curve means a small increase in dose near the EC50 produces a large jump in effect, making precise dose titration difficult and leaving little room between the therapeutic dose and a dose that is too high. Many drugs with narrow therapeutic windows — lithium, warfarin, digoxin — have steep dose-response curves as part of their pharmacodynamic profile.
The graded dose-response curve measures the magnitude of a continuous response in one preparation. It answers the question: how much effect does a given drug concentration produce? The quantal dose-response curve is different in both design and purpose. It measures an all-or-none endpoint — a response that is either present or absent — across a population of subjects. It answers the question: what fraction of a population exhibits the defined response at each dose?
When cumulative response fraction is plotted against the logarithm of dose, the quantal curve is also sigmoidal. The key parameter is the median effective dose, abbreviated ED50, which is the dose at which 50 percent of the population exhibits the defined endpoint. The ED50 from a quantal curve is a population statistic, not an individual pharmacodynamic measurement. The median lethal dose (LD50) and median toxic dose (TD50) are derived the same way, using lethality or a defined toxic endpoint in place of the therapeutic endpoint. These parameters provide the inputs for calculating the therapeutic index, covered in Section 3.
Graded vs. Quantal — Key Distinctions
Graded curve: measures continuous response intensity in one preparation; parameters are Emax and EC50; answers “how much effect?”
Quantal curve: measures all-or-none endpoint frequency across a population; parameters are ED50, TD50, LD50; answers “what fraction of patients respond?”
EC50 (graded) and ED50 (quantal) are different measurements and are not interchangeable, though both describe potency in a broad sense.
Section 2
Two independent drug properties that are frequently confused and clinically distinct
Potency and efficacy are the two properties most commonly read off a dose-response curve, and they are independent of each other. A drug can be highly potent but have low efficacy. A drug can have high efficacy but be relatively weak in potency. Knowing which property matters for a given clinical situation determines how drugs within a class should be compared and selected.
Potency refers to the concentration required to produce a given effect. It is measured by the EC50: a drug with a lower EC50 is more potent because it achieves the same response at a lower concentration. On a log dose-response graph, a more potent drug’s curve sits to the left of a less potent drug’s curve.
Efficacy refers to the maximum effect a drug can produce, which is Emax. A drug with a higher Emax is more efficacious. On a log dose-response graph, a more efficacious drug’s curve reaches a higher plateau. Importantly, Emax is determined by what the drug-receptor complex can do once formed — a property intrinsic to the drug’s interaction with the receptor and downstream pathway. No amount of additional drug can push a drug’s response above its own Emax.
Morphine and codeine are both full agonists at the mu-opioid receptor — they have the same Emax for analgesia in that sense. But morphine is roughly ten times more potent than codeine on a milligram-for-milligram basis: it takes about 10 milligrams of oral morphine to produce what requires approximately 100 milligrams of oral codeine. The two drugs differ in potency, not efficacy.
Buprenorphine illustrates the difference in a different direction. It has very high receptor affinity and a low EC50 — it is highly potent. But as a partial agonist at the mu-opioid receptor, its Emax for pain relief is lower than that of morphine. A patient with severe acute pain may be undertreated by buprenorphine even at doses that fully occupy opioid receptors, because the drug’s ceiling effect limits the response. Here, the limiting property is efficacy, not potency.
Furosemide and hydrochlorothiazide are diuretics that illustrate this principle at the clinical level. Furosemide is a loop diuretic with a substantially higher Emax for diuresis than hydrochlorothiazide — it can produce far greater urine output at ceiling doses. Hydrochlorothiazide is effective for mild to moderate fluid retention and hypertension, but in a patient with severe heart failure or renal impairment who needs maximum diuresis, furosemide’s higher efficacy is what matters. The relative potencies of the two drugs on a milligram-for-milligram basis are irrelevant to that clinical decision.
Potency matters most when dose size is constrained — for example, in a highly concentrated injectable formulation, or when systemic exposure at higher doses causes unacceptable off-target effects. In those situations, switching to a more potent drug in the same class allows the same therapeutic effect at a lower dose.
Efficacy matters most when the required therapeutic response approaches the maximum the system can produce. In pain management, sedation, diuresis, or seizure suppression, the question is often not how little drug is needed but whether the drug can reach the ceiling of effect that the clinical situation demands. Partial agonists and drugs with lower Emax values may be perfectly appropriate for mild to moderate presentations while being inadequate for severe ones.
Potency vs. Efficacy at a Glance
Potency = EC50. Lower EC50 = more potent = leftward curve shift. Clinically: matters when dose must be low.
Efficacy = Emax. Higher Emax = more efficacious = higher curve plateau. Clinically: matters when maximum effect is needed.
The two are independent: buprenorphine is more potent than morphine (lower EC50, higher affinity) but less efficacious (lower Emax as a partial agonist). Furosemide is more efficacious than hydrochlorothiazide for diuresis but is not necessarily more potent on a milligram basis.
Section 3
Quantifying the margin between a drug’s effective and toxic doses
No drug produces only the effects we want. Every drug at some dose will produce toxicity, and the key question for safe clinical use is how much separation exists between the dose that works and the dose that harms. The therapeutic index is the quantitative expression of that separation.
The therapeutic index is defined as the ratio of the median lethal dose to the median effective dose: LD50 divided by ED50. A drug with an LD50 of 1000 milligrams per kilogram and an ED50 of 10 milligrams per kilogram has a therapeutic index of 100 — the lethal dose is one hundred times the effective dose. A drug with an LD50 of 20 milligrams per kilogram and an ED50 of 10 milligrams per kilogram has a therapeutic index of 2, meaning a dose only twice the effective dose is lethal in half the population.
In practice, the LD50 and ED50 used to calculate the therapeutic index classically come from animal studies, and direct lethal dose measurements in humans are ethically and practically impossible for most drugs. In clinical pharmacology the concept translates to the ratio of the minimum toxic concentration to the minimum effective concentration in plasma — the therapeutic window. A drug is within its therapeutic window when its plasma concentration is high enough to produce the desired effect but not so high as to produce unacceptable toxicity.
A drug with a wide therapeutic index has a large separation between its effective and toxic doses. Most antibiotics, such as penicillins and cephalosporins, have therapeutic indices in the hundreds or thousands — it is essentially impossible to prescribe a toxic dose in normal clinical use. These drugs can be dosed using straightforward weight-based or population-based guidelines without individualized plasma monitoring.
A drug with a narrow therapeutic index has a small separation between effective and toxic doses. The effective concentration range overlaps uncomfortably close to the range where toxicity begins. These drugs require individualized dosing, regular plasma concentration monitoring, and careful attention to factors that alter drug disposition.
The most important narrow therapeutic index drugs for a second-year student to know are warfarin, lithium, digoxin, phenytoin, theophylline, and the aminoglycoside antibiotics (gentamicin, tobramycin, amikacin). Each of these has a different mechanism of toxicity — warfarin causes bleeding, lithium causes neurological toxicity, digoxin causes cardiac arrhythmias, aminoglycosides cause nephrotoxicity and ototoxicity — but the common feature is that the toxic plasma concentration is only modestly above the therapeutic plasma concentration. Individual variation in metabolism, renal function, drug interactions, or body composition can push any patient from therapeutic to toxic with a dose that would be appropriate for someone else.
The therapeutic index concept explains why some drugs require therapeutic drug monitoring — regular measurement of plasma drug concentrations — while others do not. For warfarin, the international normalized ratio (a measure of anticoagulation effect rather than plasma drug concentration) is monitored because the effect varies with diet, other drugs, and genetic factors. For lithium and aminoglycosides, trough and peak plasma concentrations are measured directly. For digoxin, periodic digoxin levels and electrocardiographic monitoring are standard. For phenytoin, free (unbound) plasma concentration monitoring accounts for the drug’s high protein binding.
The therapeutic index also shapes the design of clinical trials. For drugs with narrow therapeutic indices, dose-finding studies are more conservative, dose escalation is slower, and safety monitoring is more intense, because the margin for error is smaller.
Narrow Therapeutic Index Drugs to Know
Warfarin: monitor international normalized ratio; affected by diet (vitamin K), many drug interactions, and genetic variation in metabolism.
Lithium: monitor plasma lithium levels; toxicity risk increases with sodium depletion, dehydration, and nonsteroidal anti-inflammatory drug co-administration.
Digoxin: monitor digoxin levels and electrocardiogram; toxicity causes arrhythmias and visual disturbances; hypokalemia increases toxicity risk.
Phenytoin: monitor free phenytoin levels; nonlinear (zero-order) kinetics at therapeutic doses mean small dose increases can cause large concentration jumps.
Aminoglycosides (gentamicin, tobramycin): monitor peak and trough levels; nephrotoxicity and ototoxicity depend on cumulative exposure and trough concentrations.
Section 4
Why maximum drug effects can occur at less than full receptor occupancy, and what this means clinically
One of the more counterintuitive findings in pharmacology is that many tissues contain far more receptors than are strictly needed to generate a maximum response. When a full agonist produces its maximum effect while occupying only a fraction of available receptors, the excess are called spare receptors or receptor reserve. Understanding this concept resolves apparent paradoxes in drug potency, explains how irreversible antagonists behave in the body, and clarifies why aspirin in low doses selectively inhibits platelet function.
When a drug binds its receptor and initiates signaling, the initial receptor signal is amplified many times over by downstream cascades — G proteins activate enzymes, enzymes generate second messengers, second messengers activate kinases, and so on. Because of this amplification, a relatively small fraction of occupied receptors can be enough to fully saturate the effector pathway and produce the maximum tissue response. The receptors beyond that threshold are “spare” in a functional sense: occupying them produces no additional response because the effector system is already running at maximum.
The experimental signature of receptor reserve is a discordance between EC50 and Kd. In a tissue with significant receptor reserve, a full agonist’s EC50 (measured from the functional dose-response curve) is lower than its Kd (measured from a binding assay). The agonist produces its half-maximal functional effect at a concentration well below the concentration needed to occupy half the receptors, because the amplified signal from a small fraction of occupied receptors already drives the effector pathway to 50 percent of its maximum output.
Receptor reserve makes EC50 values tissue-dependent. A full agonist will appear more potent (lower EC50) in a tissue with large receptor reserve than in a tissue where every receptor needs to be occupied to achieve the maximum response. This means that comparing EC50 values across different tissues or assay systems can be misleading as an estimate of receptor affinity. EC50 reflects not just affinity but also the signal amplification efficiency of the tissue.
This tissue-dependence has a clinical consequence. The same opioid drug may have different apparent potencies for analgesia versus respiratory depression because the receptor reserve and signal coupling efficiency differ between nociceptive pathways and respiratory control centers in the brainstem. Differences in receptor reserve between tissues are one reason why drugs in the same class can have clinically distinct ratios of desired to adverse effects.
Receptor reserve also determines how a partial agonist behaves in a given tissue. In a tissue with large receptor reserve, a partial agonist may produce a full maximal response — because even though each occupied receptor generates less signal than a full agonist would, enough reserve receptors exist that the cumulative signal is still sufficient to saturate the effector pathway. In a tissue with little receptor reserve, the same partial agonist fails to produce a maximal response because the lower per-receptor signal cannot be amplified enough to reach the effector maximum.
This explains one aspect of buprenorphine’s clinical profile. Respiratory depression in the brainstem operates with relatively limited opioid receptor reserve, so buprenorphine’s partial agonism translates into a genuine ceiling effect on respiratory depression. Analgesia involves pathways with somewhat greater receptor reserve, allowing buprenorphine to produce more meaningful pain relief than its partial agonism might suggest at first glance.
Receptor reserve acts as a buffer against irreversible receptor blockade. When an irreversible antagonist permanently inactivates a fraction of receptors, the spare receptors provide a cushion: as long as the remaining active receptors exceed the minimum needed to saturate the effector pathway, Emax is preserved. Only when enough receptors have been permanently blocked to push the remaining active receptors below that minimum does Emax begin to fall. Up to that point, the dose-response curve shifts rightward (more agonist is needed to occupy the smaller pool of available receptors), but the maximum effect remains intact.
Aspirin illustrates this in reverse. Aspirin irreversibly inactivates cyclooxygenase-1 in platelets. Platelet aggregation through the thromboxane A2 pathway operates with virtually no cyclooxygenase enzyme reserve — even partial inhibition of platelet cyclooxygenase significantly impairs thromboxane A2 synthesis and aggregation. In contrast, prostacyclin production in vascular endothelial cells, which opposes platelet aggregation, requires more substantial cyclooxygenase inhibition to be suppressed, partly because vascular endothelium can synthesize new cyclooxygenase (unlike anucleate platelets). This biochemical asymmetry allows low-dose aspirin to selectively inhibit platelet aggregation while leaving vascular prostacyclin production relatively intact.
Receptor Reserve — Core Points
Spare receptors: maximum effect is achieved at less than full receptor occupancy, because downstream signal amplification saturates the effector pathway at low occupancy.
EC50 < Kd when receptor reserve is present: functional potency is higher than binding affinity predicts.
Partial agonists: may reach full Emax in tissues with large reserve; fail to reach full Emax in tissues with limited reserve — explaining tissue-specific ceiling effects.
Irreversible antagonists: Emax is preserved until enough receptors are permanently blocked to exhaust the reserve; only then does Emax fall.
Aspirin: near-complete inhibition of platelet cyclooxygenase-1 is achievable at low doses because platelet aggregation operates with minimal enzyme reserve.
| Author / Organization | Title | Source |
|---|---|---|
| Stephenson RP | A modification of receptor theory | Br J Pharmacol Chemother. 1956;11(4):379-393. |
| Kenakin T | What is pharmacological affinity? Relevance to biased agonism and antagonism | Trends Pharmacol Sci. 2014;35(9):434-441. |
| Fudala PJ, Bridge TP, Herbert S, et al. | Office-based treatment of opiate addiction with a sublingual-tablet formulation of buprenorphine and naloxone | N Engl J Med. 2003;349(10):949-958. |
| Mailman RB | GPCR functional selectivity has therapeutic impact | Trends Pharmacol Sci. 2007;28(8):390-396. |
| Kenakin T | Functional selectivity and biased receptor signaling | J Pharmacol Exp Ther. 2011;336(2):296-302. |
| Furchgott RF | The use of beta-haloalkylamines in the differentiation of receptors and in the determination of dissociation constants of receptor-agonist complexes | Adv Drug Res. 1966;3:21-55. |