|
|
|
|
|
|
|
Chapter 3: General Principles: Pharmacodynamics
|
|
|
|
|
|
|
Why the Dose-Response Relationship Is the Central Concept of Pharmacodynamics
Every question in clinical pharmacology ultimately reduces to a dose-response relationship.
Why does a drug work at one dose but fail at a lower one?
Why does toxicity appear at higher doses?
How do we compare the clinical utility of two drugs that act at the same receptor?
How do we set a dosing regimen that achieves efficacy in the majority of patients without causing unacceptable harm in a significant minority?
None of these questions can be answered without a quantitative framework for understanding how drug effect changes as a function of drug concentration or dose.
The dose-response relationship is not a single curve given that it is a family of mathematical tools, each suited to a different type of question.
Graded dose-response curves describe how the magnitude of an effect changes with drug concentration in an individual.
Quantal dose-response curves describe how the frequency of an all-or-none response changes across a population.
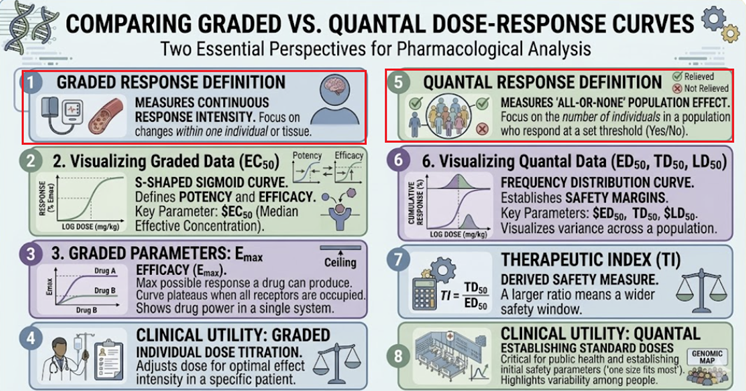 |
The Hill equation provides the mathematical backbone connecting them both. The therapeutic index translates all of this into a clinically actionable safety metric.
This section develops each of these tools systematically, from their mathematical foundations to their clinical applications.
Taken together. these elements form quantitative core of pharmacodynamics which is the framework that makes rational prescribing something more than intuition.1,2
Graded Dose-Response Curves: Effect in an Individual
A graded dose-response curve (also called a concentration-response curve when plasma concentration is used on the x-axis) describes the relationship between the dose or concentration of a drug and the magnitude of a measurable biological effect in a single biological system such as a cell, an isolated tissue, an organ, or an individual patient.
 |
Important characteristics of a graded dose-response curve include:
A continuous response increasing smoothly as dose increases.
The response is measurable in graded units such as:
Heart rate in beats per minute
Blood pressure in mmHg
Bronchodilation as FEV1
Tumor shrinkage as percentage reduction
The curve approaches a maximum in which at some dose, further increases produce no additional response.
This maximum is the Emax (maximum effect or maximal efficacy)
When plotted on a linear concentration axis, the curve is hyperbolic, rising steeply at low concentrations and flattening as it approaches Emax.
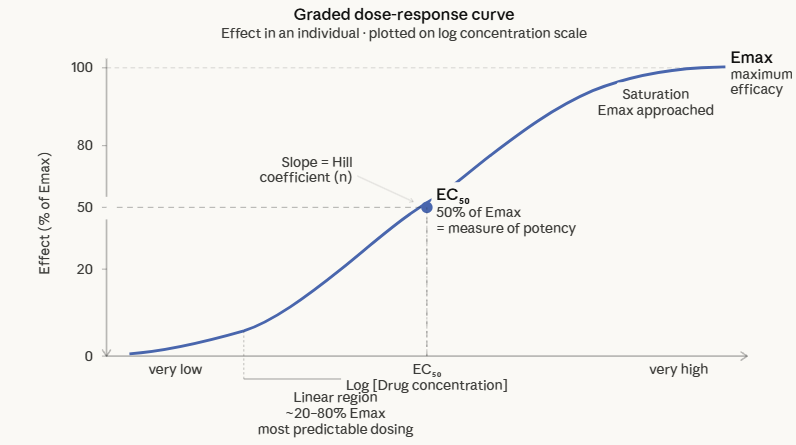
When plotted on a logarithmic concentration axis, the curve takes the familiar sigmoid (S-shaped) form.
The log-dose transformation is universal in pharmacology because it compresses the wide range of biologically relevant concentrations into a manageable scale and reveals the linear portion of the curve. this linear region is one in which effect is most predictably proportional to concentration.
Two parameters extracted from the graded dose-response curve are especially clinically important:
(1) Emax (maximal efficacy)
The maximum effect achievable by the drug regardless of dose, determined by the nature of the drug-receptor interaction and the capacity of the effector system.
A drug cannot produce more than its Emax even if the dose is increased to toxic levels.
Emax is the ceiling of therapeutic effect.
(2) EC50 (half-maximum effective concentration)
The concentration of drug producing 50% of the maximum effect.
EC50 is the standard measure of potency where the lower the EC50, the smaller the concentration needed to achieve a given effect, and therefore the more potent the drug.1,2,6
Potency vs Efficacy: The Most Important Distinction in Clinical Pharmacology
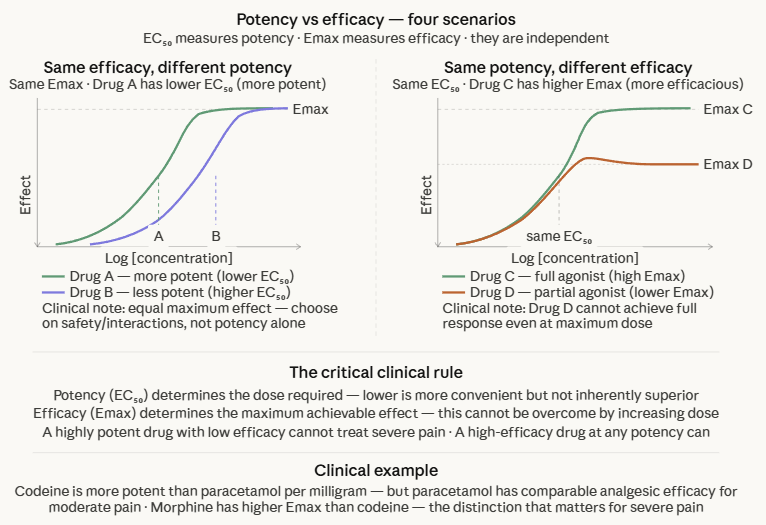 |
These two properties are entirely independent of each other, and a drug can have any combination of them.
![]() Potency
is the dose or concentration required to produce a defined
effect.
Potency
is the dose or concentration required to produce a defined
effect.
Potency is quantified by EC50 (or ED50 in a population).
A highly potent drug achieves its effect at a low concentration.
A low-potency drug requires a higher concentration to achieve the same effect.
Potency determines the dose required but does not predict how large an effect the drug can ultimately produce.
![]() Efficacy
(maximal efficacy, Emax) is the maximum biological
effect a drug can produce, independent of dose.
Efficacy
(maximal efficacy, Emax) is the maximum biological
effect a drug can produce, independent of dose.
Therefore, efficacy in representing a ceiling describe a fundamental characteristic of the drug-receptor-effector system interaction.
A drug with high efficacy produces a large maximum response.
A drug with low efficacy produces a smaller maximum response no matter how high the dose.
![]() Clinical
Implications
Clinical
Implications
A drug may be highly potent but low efficacy in that it produces its effect at very low doses, but that effect is modest.
Codeine is a far more potent analgesic than acetaminophen on a per-milligram basis, but has a lower maximum analgesic efficacy since the drug can not control severe post-operative pain even at high doses.
Acetaminophen at standard doses actually provides comparable analgesia for moderate pain despite being pharmacologically "less potent."
A drug may be highly efficacious but low potency if it can produce large effects on one hand, but only does so at high doses.
This cases is not inherently a problem as dose may be adjusted.
![]() Low
potency only matters when the doses required to achieve efficacy
approach toxic levels, or when impractically large tablet sizes
would be needed.
Low
potency only matters when the doses required to achieve efficacy
approach toxic levels, or when impractically large tablet sizes
would be needed.
When choosing between drugs for efficacy, choose based on Emax.
When choosing for safety margin or dose convenience, consider EC₅₀.
Preferring a drug because it is "more potent" is only meaningful if the pharmacological effect is the same and you want to use a smaller dose. Therefore, drug potency should not be confused with superiority of effect1,2,6
The Hill Equation: The Mathematical Foundation
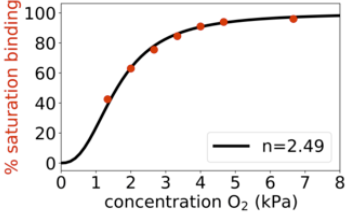
The sigmoid concentration-response curve, the visual centerpiece of pharmacodynamics, is described mathematically by the Hill equation.
This equation was derived by Archibald Vivian Hill in 1910 to describe the cooperative binding of oxygen to hemoglobin.3
 |
|
Hill originally expressed it as a description of equilibrium binding, but it was rapidly adopted by pharmacologists because it describes concentration-response data with remarkable accuracy across a vast range of drug-receptor systems.4,5
The Hill equation as used in pharmacology is:
E = Emax ∙ [A]ⁿ /
(EC₅₀ⁿ + [A]ⁿ) Where:
E =
the observed effect at concentration [A]
Emax =
the maximum possible effect
[A] =
the drug concentration
EC50
= the concentration producing 50% of Emax
n =
the Hill
coefficient (also written n_H or h)
When n = 1, the Hill equation reduces to the simple Emax model, which is mathematically identical to the Michaelis-Menten equation from enzyme kinetics and to Clark's original occupancy equation from an earlier section.
This is the baseline case, a simple hyperbolic binding relationship yielding upon transformation the corresponding log-concentration response curve is a symmetric sigmoid with a specific slope.\
![]() The
Hill coefficient (n) describes the slope of the sigmoid
curve and provides information about the underlying
molecular mechanism:
The
Hill coefficient (n) describes the slope of the sigmoid
curve and provides information about the underlying
molecular mechanism:
n = 1:
Simple non-cooperative binding in which one drug molecule binds one receptor with no interaction between binding sites.
The slope of the log-dose response curve at its midpoint follows the classical single-site binding equation.
Most drugs in clinical use have Hill coefficients close to 1.
n > 1:
Positive cooperativity in which binding of one molecule to the receptor increases affinity of subsequent binding events.
The curve is steeper than predicted by simple mass action.
Hemoglobin's oxygen binding (n ≈ 2.8) is a classical case.
Some ligand-gated ion channels show cooperativity because multiple agonist molecules must bind to open the channel.
The nicotinic acetylcholine receptor, nH ≈ 1.5–2 is such an example.
n < 1: Negative cooperativity in which binding of one molecule reduces affinity for subsequent binding.
The curve is shallower than predicted.
Less common in clinical pharmacology but observed for some receptor populations with heterogeneous affinities.
Practical importance of the Hill coefficient
The steepness of the dose-response curve has direct clinical consequences.
For a drug with n = 1, doubling the dose from EC₅₀ (50% effect) raises the effect to ~67% of maximum, representing a modest increase.
For a drug with n = 4, the same doubling raises the effect from 50% to ~94% of maximum which would be an enormous increase.
Drugs with steep dose-response curves (high n) have a narrow range of doses separating inefficacy from toxicity.
Opioids, for example, have steep dose-response curves for respiratory depression, which contributes to the narrow margin between analgesic and lethal doses.4,8,9
The Hill equation is an empirical model since its parameters (Emax, EC50, n) are fitted to observed data without requiring detailed knowledge of the molecular mechanism.
This aspect is both its strength, as the analysis can be applied to virtually any quantitative drug effect, and its limitation because the Hill coefficient n is a parameter that is not a direct molecular measure of cooperativity.4,5
Quantal Dose-Response Curves: Effect Across a Population
![]() Graded dose-response curves measure the
magnitude
of an effect in an individual as dose increases.
Graded dose-response curves measure the
magnitude
of an effect in an individual as dose increases.
A fundamentally different question is: at what dose will a given fraction of a population exhibit a defined all-or-none response?
This is answered by the quantal dose-response curve.
A quantal response is binary, either present or absent in any given individual.
The response is "quantal" (all-or-none):
Pain is relieved or not
A seizure is prevented or not
An arrhythmia is suppressed or not
A patient dies or does not.
No intermediate is measured
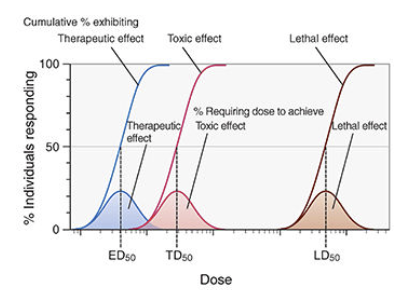
The quantal dose-response curve is constructed by administering different doses to different groups and recording the percentage of individuals in each group that exhibit the defined response.
The result is a sigmoid curve plotting percentage responding (y-axis) against log dose (x-axis).
Individual variation in sensitivity to a drug due to possible differences in pharmacokinetics, receptor polymorphisms, age, organ function, and other factors are responsible for the spread of the quantal curve.
A narrow quantal curve indicates a homogeneous population.
A wide curve reflects high inter-individual variability.
Three parameters define the quantal dose-response curve:
(1) ED₅₀ (median effective dose)
The dose at which 50% of the population exhibits the defined therapeutic response.
ED₅₀ from a quantal curve is a population statistic and is distinct from EC₅₀ from a graded curve, which is a concentration producing 50% of maximum effect in an individual.7
(2) TD₅₀ (median toxic dose)
The dose at which 50% of the population exhibits a defined toxic response.
(3) LD₅₀ (median lethal dose)
The dose at which 50% of subjects die.
This index is used in preclinical animal studies; rarely applicable directly to clinical dosing but important in toxicology.
 |
|
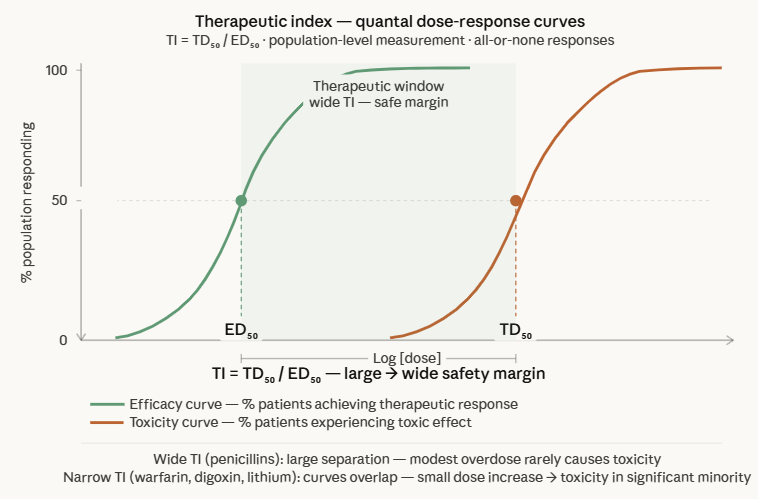 |
The therapeutic index (TI) is the quantitative expression of a drug's safety margin represented by the ratio between the dose that causes toxicity and the dose that produces the desired effect:
TI = TD50 / ED50
A wide therapeutic index (large TI) means that substantial dose increases are required before toxicity appears in a significant portion of the population.
A narrow therapeutic index means that the dose required for efficacy in most patients overlaps with the dose causing toxicity in some patients.1,2,7
The therapeutic index changes with the clinical context.
Several factors compress a drug's effective TI in clinical practice:
![]() Inter-individual
pharmacokinetic variability
Inter-individual
pharmacokinetic variability
This factor refers to the case in which administration of the same drug dose produces different plasma concentrations in different patients.
A patient with renal impairment receiving a drug cleared by the kidney will have higher plasma concentrations than predicted, effectively shifting them up the dose-response curve.
A patient who is a CYP poor metabolizer will accumulate drug more rapidly than expected.
![]() Drug interactions can shift a patient's
effective position on the dose-response curve
without changing the prescribed dose.
Drug interactions can shift a patient's
effective position on the dose-response curve
without changing the prescribed dose.
CYP inhibitors raise plasma concentrations,
CYP synthesis inducers lower them.
Overlap between efficacy and toxicity curves
TI ratios conceal the slopes of the underlying curves.
![]() If the toxicity curve is
steeper than the efficacy curve, even a
modestly higher dose may cross into
toxicity far more rapidly than the TI
ratio would suggest.
If the toxicity curve is
steeper than the efficacy curve, even a
modestly higher dose may cross into
toxicity far more rapidly than the TI
ratio would suggest.
The certain safety factor (Certain Safety Factor = LD1/ED99) is a more conservative and clinically meaningful measure than the Therapeutic Index since it takes into account whether the dose required to kill the most sensitive 1% of animals overlaps with the dose required to treat 99% of the population.
![]() A drug can have a reasonable TI but a
dangerous certain safety factor if its
efficacy and toxicity curves have very
different slopes.1,2
A drug can have a reasonable TI but a
dangerous certain safety factor if its
efficacy and toxicity curves have very
different slopes.1,2
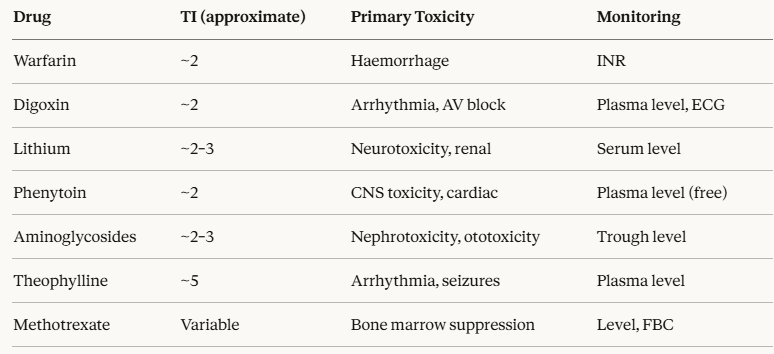
Narrow therapeutic index drugs in clinical practice require therapeutic drug monitoring, careful dose individualization, and close clinical surveillance.
Examples and their monitoring requirements:
 |
Importance of Log-Dose Transformations
The logarithmic transformation of the dose axis, converting the hyperbolic linear dose-response curve into a sigmoid log-dose response curve, is more than a mathematic abstraction.
The transform has both practical and conceptual significance that should be understood.
Practical reasons
Biologically relevant drug concentrations span many orders of magnitude, from picomolar (10-12M) for some peptide hormones to millimolar (10-3M) for some anesthetics.
Log scale compresses this enormous range into a readable graph.
The linear portion of the sigmoid log-dose curve corresponding to the region between approximately 20% and 80% of maximum effect, is where dose-response relationships are most approximately linear.
This range is where dosing adjustments produce predictable, proportional changes in effect.
Conceptual significance
Clark and Gaddum first introduced the log concentration-effect curve in the 1920s.
This representation led to appreciation that competitive antagonists produce a parallel rightward shift of the curve without changing Emax.
The log-dose plot is the coordinate system in which the landmark relationships of receptor pharmacology become visually apparent.
Clinical implication
Because the log-dose response curve is approximately linear between 20% and 80% of maximum effect, dose adjustments within this range are predictable.
At the extremes defined as below 20% of Emax (where the curve is concave and rising steeply) or above 80% (where the curve is flattening) dose adjustments produce disproportionate changes.
This effect at extremes occurs because at very small doses of high-potency drugs require precise measurement attempting to push to maximum effect often requires very large dose increases for diminishing gains, while risk of toxicity continues to rise linearly.1,8
Potency, Efficacy, and the Dose-Response Curve: Clinical Scenarios
Scenario 1
Opioid analgesia in opioid-tolerant patients
Tolerance shifts the dose-response curve to the right as the EC50 for analgesia increases while Emax may be preserved.
The dose must be increased to recapture the EC50 position on the curve, not because the drug has lost efficacy, but because the curve has shifted.
Scenario 2
Comparing antihypertensives
Two sartan class drugs may have very different EC50 values (potencies) but identical Emax values (equal maximum blood pressure reduction). Neither is "better" than the other in terms of efficacy.
![]() The
choice between them would be based upon:
The
choice between them would be based upon:
Adverse effect profiles
Drug interactions, and
cost, not by misinterpreting the lower-EC50 drug as pharmacologically superior.
Scenario 3
Fixed-dose combination therapy
Combining two drugs that act at different points in the same pathway can shift the dose-response curve to the left (increased apparent potency), or increase Emax beyond what either drug can achieve alone.
This approach explains a pharmacodynamic rationale for fixed-dose antihypertensive combinations with each drug at a lower dose, capturing the steep linear portion of its dose-response curve with both additive effects on blood pressure and reduced adverse effects from each individual component.
Scenario 4
Narrow TI drugs after organ impairment
Acute kidney injury in a patient stabilized on gentamicin abolishes the pharmacokinetic assumptions on which the dosing regimen was built.
The renal dysfunctions results in increasing gentamicin plasma levels as the patient moves up their dose-response curve for both efficacy and toxicity.
Therapeutic Drug Monitoring (TDM) and dose adjustment are not optional in this scenario.1,2
 |
|
|
|
|
|
|
|
|